LIVE
Loading...
LIVE
Loading...
The gold market outlook May 2026 is not as simple as “gold is falling” or “gold is ready to break out.” After a strong rally earlier in the year, gold has entered a more uncertain phase. Prices have pulled back from recent highs, recovered in short bursts, and then moved sideways near important support levels.
For investors, this kind of market can be frustrating. A sharp daily drop can look alarming, while a quick recovery can make the next rally feel close. But gold rarely moves in a straight line, especially after a strong upward trend. The current phase is better understood as a test of structure rather than a simple collapse.
Golden Star Note: A correction after a strong rally is not automatically a crash. In the context of the gold market outlook May 2026, physical gold buyers should focus on market structure, premiums, support levels, and long-term demand trends before reacting emotionally to short-term price movements.
At Golden Star International Ltd, we view gold as a long-term physical asset, not only a short-term trading instrument. Customers can compare
Buy gold bars, review our
Gold Shipping & Delivery process, and read
the hidden costs of buying gold before placing an order.
To understand the current market properly, it helps to separate recent gold price action into three stages:
This pattern is common in major markets. After a strong rally, prices often need time to digest the move. Some buyers take profit, short-term traders reduce exposure, and new buyers wait for clearer levels before entering. This behavior has been a notable feature in the gold market analysis May 2026, reflecting a market that is reassessing momentum rather than reversing its long-term trend.
That does not automatically mean the gold market has turned bearish. It means conviction is being tested. For physical buyers following the gold market outlook May 2026, these periods often provide more value than dramatic headlines, creating opportunities to plan purchases strategically rather than chase emotional price moves.
For a broader long-term view, read
gold price forecast 2026–2027.
At first glance, the recent weakness in gold may look negative. But a pullback after a major rally is not the same as a crash. A crash usually involves broken market structure, panic selling, a lack of buyers, and a clear shift in the long-term trend.
The current market looks more like a correction and consolidation phase. During this type of movement:
Market Warning: A falling price does not always mean a broken market. Sometimes it means the market is removing excess speculation before deciding the next direction.
Gold remains a globally recognized store of value, especially during periods of inflation uncertainty, currency pressure, banking stress and geopolitical risk. Market standards and pricing transparency are supported by organizations such as the
London Bullion Market Association.
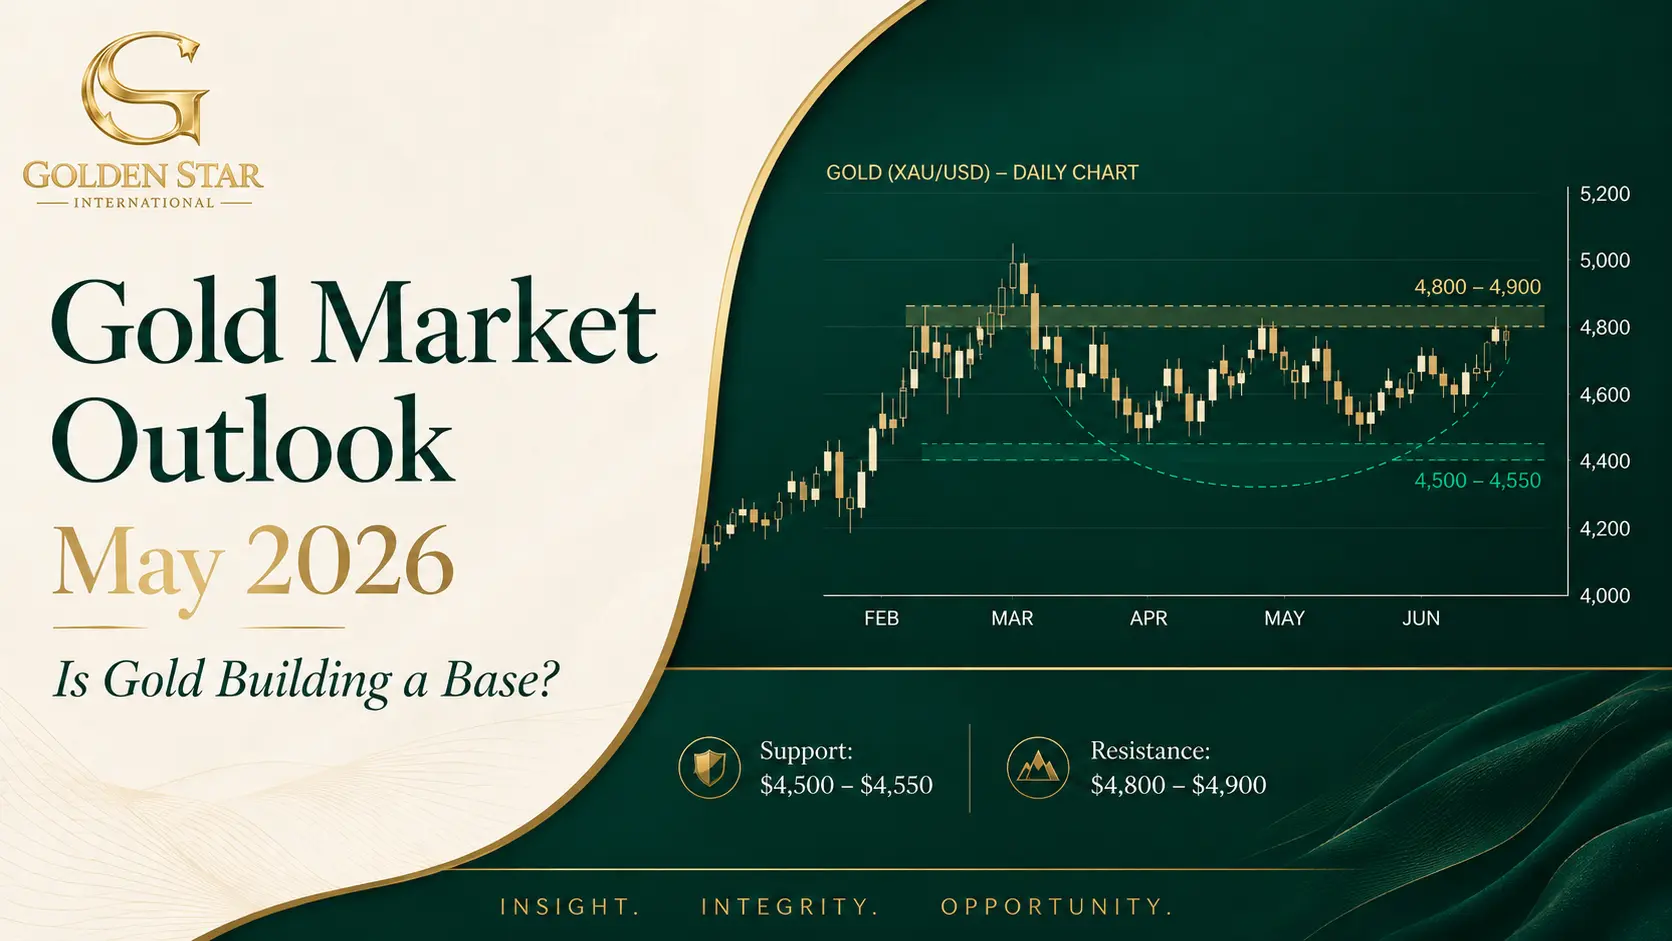
The current gold market analysis may 2026 is shaped by two important technical zones. These levels are not guarantees, but they help investors understand where buyers and sellers may become more active.
The $4,500 to $4,550 area is the key support zone to watch. If gold price continues to hold above this range, the broader structure remains more stable. Buyers may see this area as a level where value becomes more attractive after the recent correction.
The $4,800 to $4,900 area is the main resistance zone. A strong move above this range would suggest that buyers have regained control and that the market may be ready to test higher levels.
Until one of these zones breaks clearly, gold may continue to trade in a choppy range. As noted in the gold market outlook May 2026, disciplined buyers should avoid reacting to every short-term move and instead focus on their broader allocation plan.
| Price Zone | Market Meaning | Buyer Response |
|---|---|---|
| $4,500–$4,550 | Important support area | Watch whether buyers defend the level |
| $4,800–$4,900 | Main resistance area | Look for confirmation before assuming breakout |
| Below $4,500 | Could signal deeper correction | Compare premiums carefully and avoid panic buying |
| Above $4,900 | Could strengthen bullish momentum | Avoid chasing; use staged buying if needed |
No serious investor should treat a forecast as certainty. Gold is influenced by inflation data, Federal Reserve policy, Treasury yields, the U.S. dollar, central-bank buying, geopolitical risk and investor sentiment. Still, the current structure points to two main scenarios.
If gold breaks above the $4,800 to $4,900 resistance area with strength, the market could attempt to move toward the next psychological levels around $5,000 and potentially $5,200.
For this to happen, investors would likely need to see a weaker U.S. dollar, lower real-yield pressure, renewed safe-haven demand, or stronger expectations that central banks may eventually move toward easier policy.
For more on the $5,000 discussion, read
gold price 5000.
If gold fails to hold the $4,500 to $4,550 support zone, the market could correct further toward $4,350 or even $4,200.
That would create short-term pressure, but it would not automatically destroy the long-term case for physical gold. For long-term buyers, deeper corrections can sometimes create more attractive entry points, provided the purchase is made with a clear strategy and not out of panic.
If you want to understand gold weakness more clearly, read
why gold price is falling in 2026.
One common mistake is waiting for the market to feel completely safe. By the time a move becomes obvious, prices may already be significantly higher. On the other hand, buying aggressively without a plan can also be risky.
The better approach is to understand the difference between speculation and allocation. Traders try to capture short-term moves. Physical gold buyers usually have a different goal: preserving value, diversifying wealth, and holding an asset that is recognized across global markets.
That is why uncertain phases can be useful. They give investors time to compare products, understand premiums, check delivery options, and build a staged purchase plan rather than rushing in after a major breakout.
For buyers of physical gold, timing should not be reduced to guessing the exact bottom. A more practical question is whether the current price range offers a reasonable entry point for the buyer’s personal time horizon. When evaluating gold price support levels May 2026, the focus should be on long-term value and risk management rather than trying to predict the precise low of the market.
During consolidation phases, physical buyers may benefit from:
Before buying, serious investors should understand the full cost of physical gold, including premiums, delivery, payment costs and future resale spread. Our guide on
hidden costs of buying gold
explains these points in more detail.
At Golden Star, we view gold primarily as a long-term physical asset, not just a short-term trading instrument. The current market does not show a simple one-way story. Gold has corrected, but it is also attempting to stabilize near important levels.
For serious buyers, this is the moment to be selective. Product quality, transparent pricing, secure payment options and delivery confidence matter as much as the market price itself. The gold market analysis May 2026 reinforces that a lower gold price only creates real value when buyers purchase from a trusted source with transparent procedures and dependable service.
Buyers can follow broader gold market research through the
World Gold Council
and international bullion market standards through the
LBMA.
Compare investment-grade gold bars and build your position with a clear, long-term strategy.
The most balanced view of the gold market outlook May 2026 is that gold is in a transition phase. It is not clearly collapsing, but it has not yet confirmed a clean breakout either.
The key level to watch on the downside is the $4,500 to $4,550 support zone. On the upside, the market needs to break through the $4,800 to $4,900 resistance area before a stronger bullish continuation becomes more convincing.
For physical gold buyers, this environment should be approached with patience and discipline. Instead of reacting emotionally to every price move, investors should focus on long-term value, product quality, secure delivery and a clear allocation strategy.
Gold has pulled back from recent highs, but a pullback does not automatically mean a crash. The market appears to be testing support and consolidating after a strong earlier rally.
The main support zone is around $4,500 to $4,550, while the key resistance area is around $4,800 to $4,900. A clear break of either zone may shape the next major move.
Gold could move toward $5,000 if buyers regain control above resistance and if macro conditions such as lower real-yield pressure, safe-haven demand or dollar weakness support the market.
For many buyers, gradual buying is more practical than trying to identify one perfect bottom. It can reduce timing pressure and support long-term allocation discipline.
Buyers should check the product weight, brand, premium, delivery process, documentation, storage plan and future resale flexibility before placing an order.
Disclaimer: This article is for general market information only and does not constitute financial advice. Precious metals prices can rise or fall. Investors should make decisions based on their own research, risk tolerance and financial situation.
Join Golden Star Insights for practical guidance on physical gold, market outlooks, premiums, liquidity and safer buying habits.
We only send useful updates when there is something worth reading — buyer guides, market notes and selected Golden Star product or pre-sale updates.
No daily spam. No hype. Just practical updates for people who want to understand physical gold better.
great